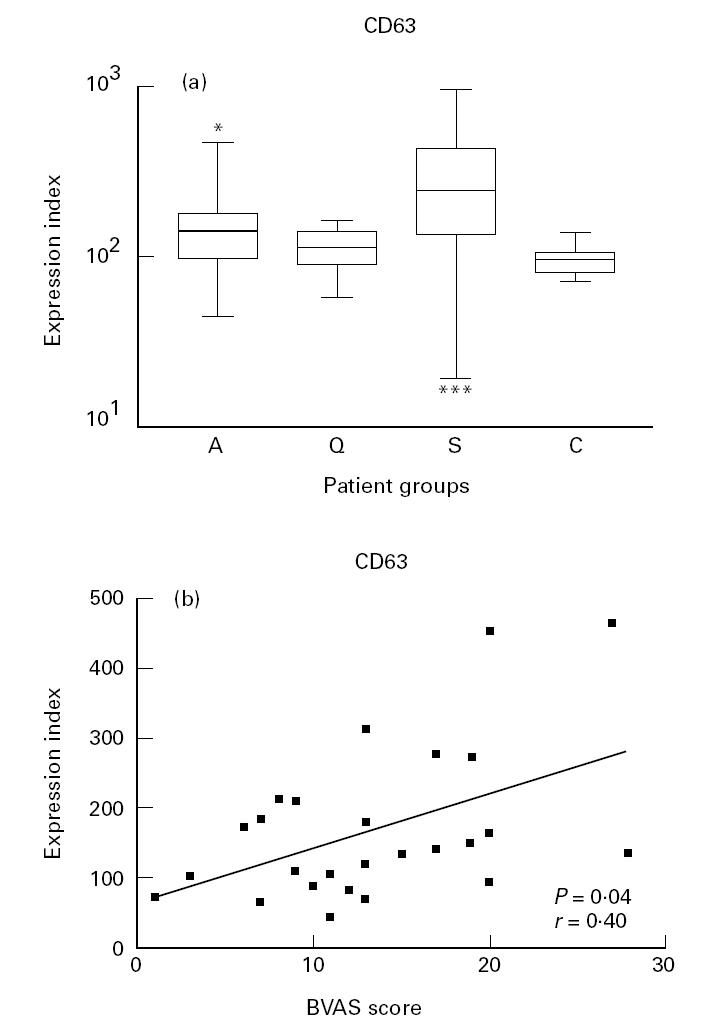
Fig. 3.

(a) Box and whisker plots indicating the overall range (error bars), 25–75% range (boxes), and median value (horizontal lines) of the surface expression of CD63 on neutrophils from patients with active (A), and quiescent (Q) ANCA-associated vasculitis, patients with sepsis (S) and healthy controls (C). *P < 0.05; ***P < 0.001 compared with healthy controls. (b) Correlation between the expression of CD63 on neutrophils and disease activity as expressed by the Birmingham Vasculitis Activity Score (BVAS).
