
Fig. 4.
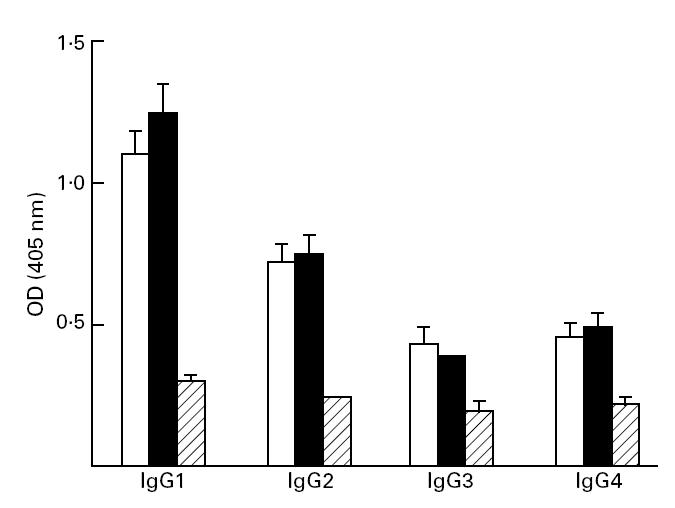
IgG subclass distribution of sodium antimony gluconate (SAG)-responsive kala-azar patients before (□) and after (▪) a single course of SAG treatment compared with healthy controls (??).Sera were diluted 1:50 and assayed by ELISA.
Official websites use .gov
A
.gov website belongs to an official
government organization in the United States.
Secure .gov websites use HTTPS
A lock (
) or https:// means you've safely
connected to the .gov website. Share sensitive
information only on official, secure websites.
IgG subclass distribution of sodium antimony gluconate (SAG)-responsive kala-azar patients before (□) and after (▪) a single course of SAG treatment compared with healthy controls (??).Sera were diluted 1:50 and assayed by ELISA.