
Fig. 2.
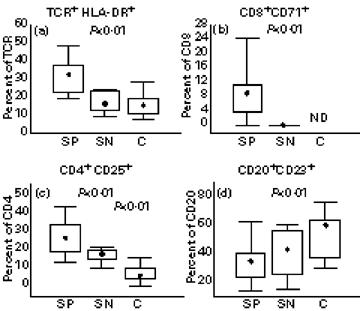
Percentage of TCR+HLA-DR+ (a), CD8+CD71+ (b), CD4+CD25+ (c) T lymphocytes, and CD20+CD23+ (d) B lymphocytes in seropositive patients (SP; n = 22), seronegative patients (SN; n = 6) and healthy controls (C; n = 15 (a), 14 (b), and 13 (d)). Box indicates 25th and 75th percentile, central point median, and whiskers indicate min-max data values. Probabilities (P) of rejecting null hypothesis for computed Conover's inequalities are indicated by dotted lines where found. ND, Not done.