
Fig. 1.
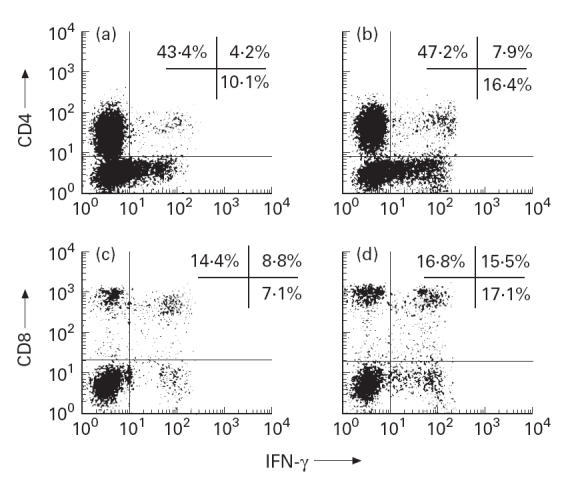
Flow cytometry analysis of CD4 versus IFN-γ (a,b) and CD8 versus IFN-γ (c,d) shows that production of IFN-γ by CD8+ (Tc1) cells exceeds production of IFN-γ by CD4+ (Th1) cells, both in AD and in control. Peripheral blood mononuclear cells (PBMC) from randomly selected AD patient (a,c) and healthy donor (b,d) were stained using anti-IFN-γ MoAb and FITC-labelled F(ab)2 goat anti-mouse IgG (abscissa), and subsequently incubated with a PE-conjugated anti-CD4 MoAb (a,b) or anti-CD8 MoAb (c,d) (ordinate), and counterstained for the surface expression of the CD3 marker, using a peridinal chlorophyll protein-conjugated MoAb Leu-4. IFN-γ expression was evaluated on the CD3-gated lymphocyte subpopulation.