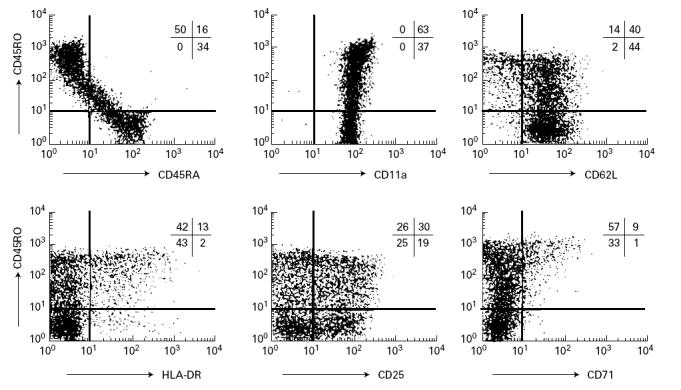
Fig. 5.

Three-colour analysis of peripheral CD4+ T cells from the ZAP-70-deficient patient. CD4+ T cells were gated by staining with PE-Cy5-labelled anti-CD4, and analysed with FITC-conjugated and PE-conjugated antibodies. Vertical and horizontal axes represent logarithm of fluorescence intensity, and the percentages of cells in each region are indicated.
