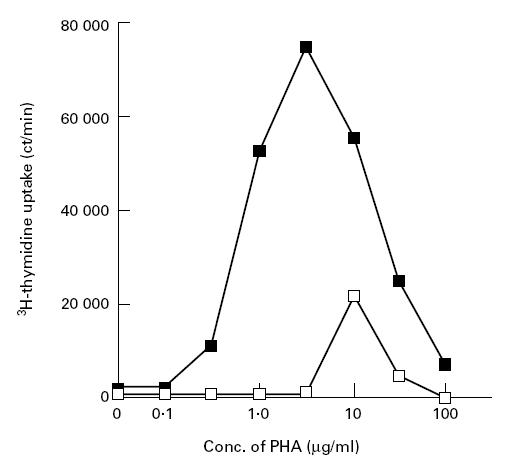
Fig. 6.

Proliferative responses of control's (▪) and patient's (□) peripheral blood mononuclear cells (PBMC) to various concentrations of phytohaemagglutinin (PHA). Data represent the mean of triplicate determinations. S.d. values are within 10% of each data point.
