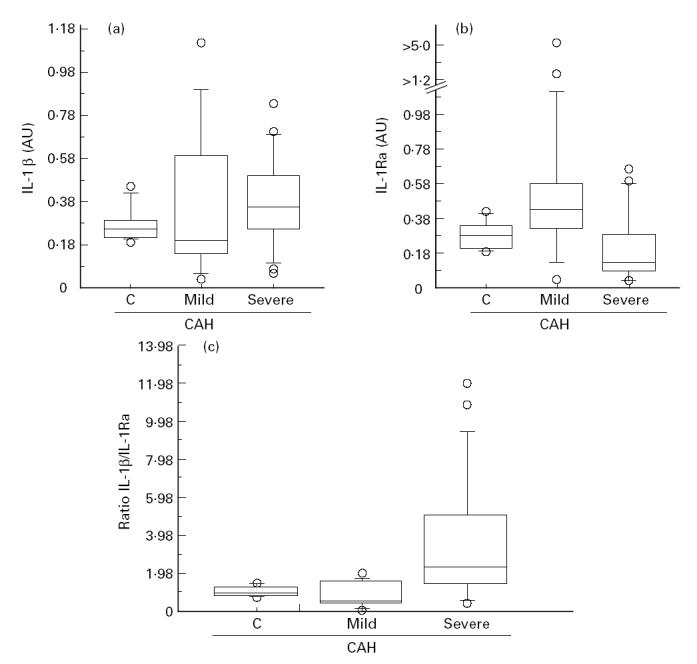
Fig. 2.

Box-plot graphic display of IL-1β integrated optical density (IOD), IL-1Ra IOD and IL-1β/IL-1Ra ratio distribution in chronic active hepatitis (CAH) of different severity. AU, Arbitrary unit; C, control livers; mild, minimal/mild CAH; severe, moderate/severe CAH. The three horizontal bars in the box from top to bottom are the 75th, 50th (median) and 25th percentiles, respectively. The upper line ends at the 90th percentile and the lower line at the 10th percentile. Outliers are represented by circles. (a) IL-1β IOD versus CAH. (b) IL-1Ra IOD versus CAH. (c) IL-1β/IL-1Ra ratio versus CAH.
