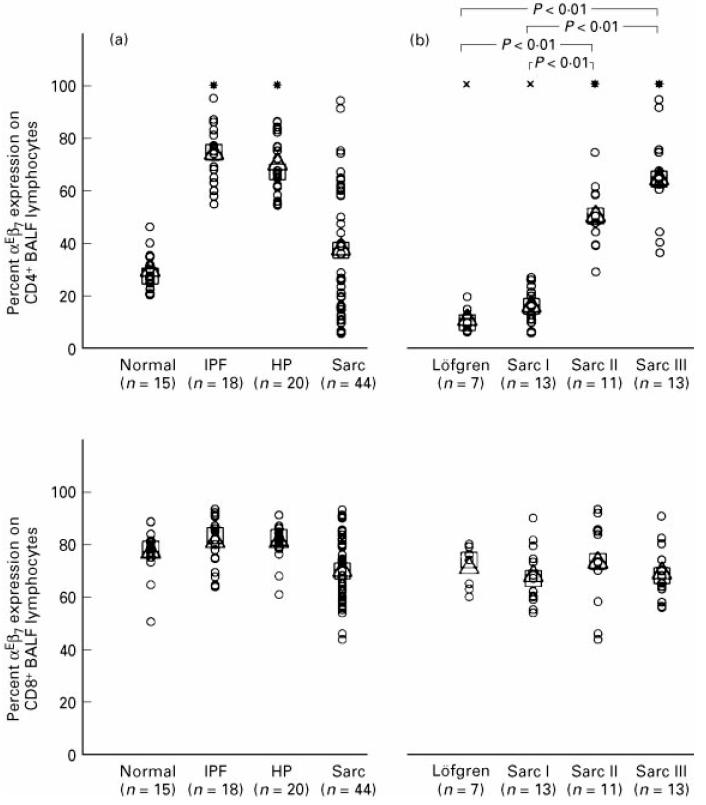
Fig. 2.

Proportion of αE-expressing CD4+ (upper part) and CD8+ (lower part) T lymphocytes in bronchoalveolar lavage fluid (BALF) determined by dual-colour immunofluorescence staining and flow cytometry. (a) Comparison of normal individuals and patients suffering form idiopathic pulmonary fibrosis (IPF), hypersensitivity pneumonitis (HP), and sarcoidosis (Sarc). (b) Comparison of sarcoidosis patients with different radiographic stages (radiographic stages I–III, Löfgren's syndrome excluded from stage I as a separate subgroup). Results are expressed as percentage αE-expressing cells within the CD4+ and CD8+ T cell subset. Single values (○), mean (Δ) and median values (□) are given. Significantly increased (*) or decreased (×) mean and median values compared with normal individuals; P < 0.01.
