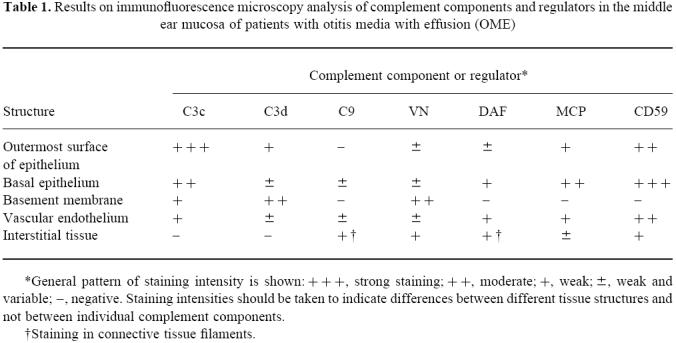
Table 1.
Results on immunofluorescence microscopy analysis of complement components and regulators in the middle ear mucosa of patients with otitis media with effusion (OME)

*General pattern of staining intensity is shown:+++ strong staining;++ moderate;+ weak;± weak and variable;−, negative. Staining intensities should be taken to indicate differences between different tissue structures and not between individual complement components.
†Staining in connective tissue filaments.
