
Table 1.
Cytokine production by T cell subsets
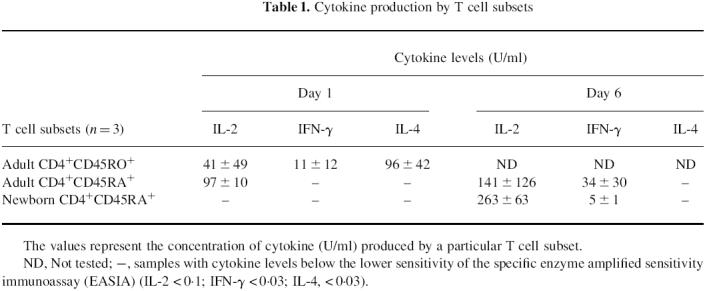
The values represent the concentration of cytokine (U/ml) produced by a particular T cell subset.
ND, Not tested; –, samples with cytokine levels below the lower sensitivity of the specific enzyme amplified sensitivity immunoassay (EASIA) (IL-2 < 0.1; IFN-g < 0.03; IL-4, < 0.03).