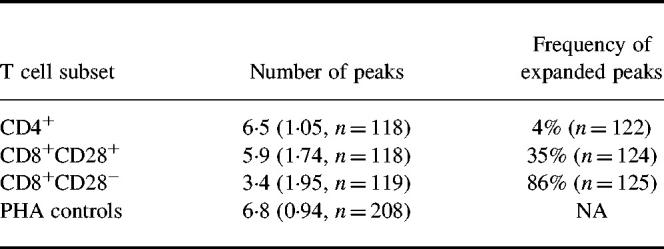
Table 1.
Number of total and expanded peaks in beta variable (BV) CDR3 length analyses of T cell subsets

The number of peaks is the mean per CDR3 length analysis, with results from all BV families from all donors grouped together. The s.d. and number of analyses are given in parentheses. The frequency of expanded peaks is the number of expanded peaks detected per BV CDR3 analysis. The number of analyses is given in parentheses. NA, Not applicable.
