
Fig. 7.
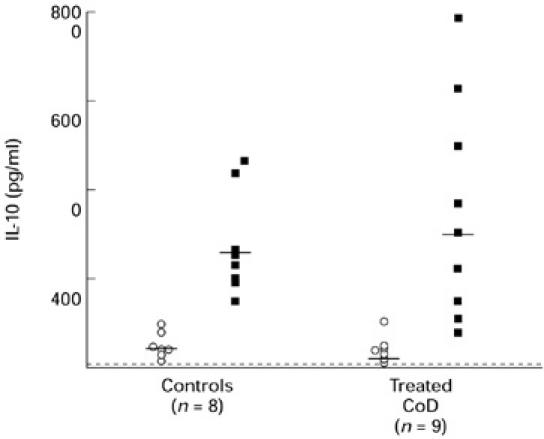
IL-10 production by PBMC in patients with treated coeliac disease (CoD) and controls. The data represent levels of IL-10 production by unstimulated cells (BG; ○) and gliadin-stimulated cells (▪) in a 72-h culture. Horizontal bar represents the mean values and the dashed line represents the detection limit of the assay.