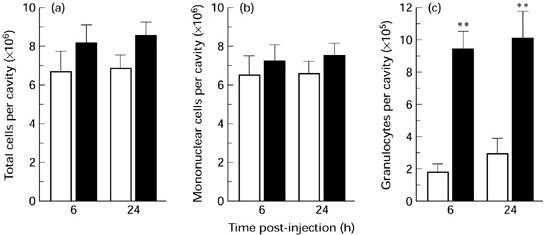
Fig. 1.

Leucocyte infiltration into the peritoneal cavity following challenge with ovalbumin (OVA). (a–c) The number of total cells, mononuclear cells and granulocytes, respectively, at 6 h and 24 h following i.p. injection of either saline (□; 0.4 ml) or OVA (▪; 10 μg) into OVA-sensitized mice. Data are expressed as the mean ± s.e.m. of six to eight mice. **P < 0.01 compared with saline controls.
