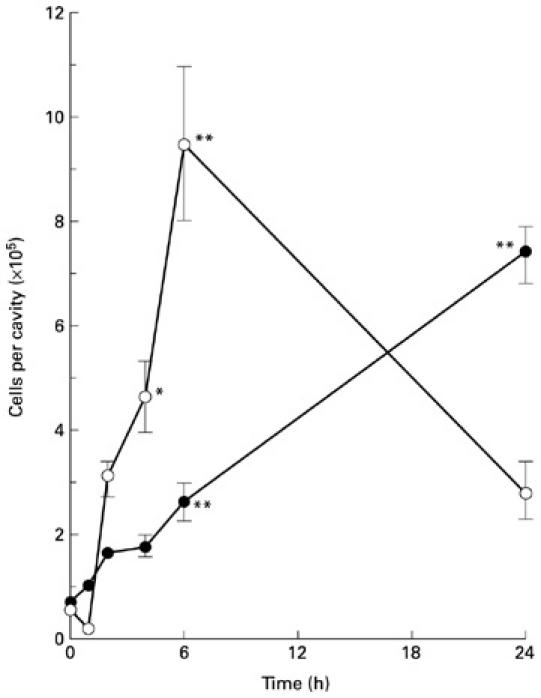
Fig. 2.

Time course of eosinophil and neutrophil accumulation into the peritoneal cavity following challenge with ovalbumin (OVA). Eosinophil (•) and neutrophil (○) numbers were quantified at different time points following i.p. challenge with OVA (0 h represents non-injected mice). Data are mean ± s.e.m. of 9–11 mice. *P < 0.05; **P < 0.01 compared with non-injected controls.
