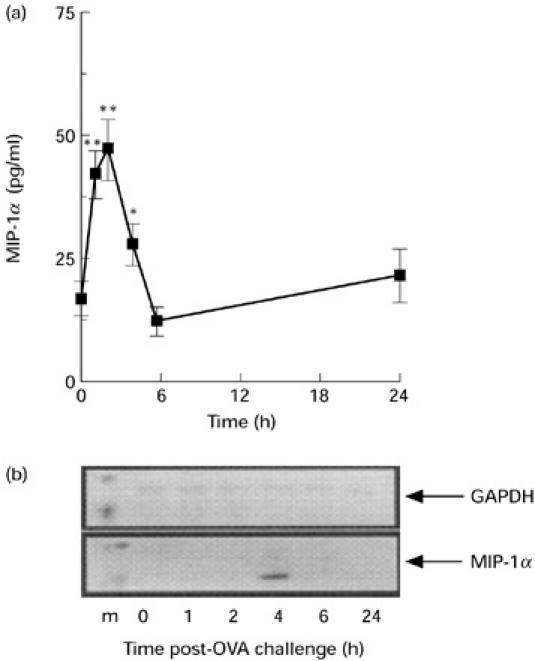
Fig. 4.

Time course of MIP-1α protein and gene expression following challenge with ovalbumin (OVA). (a) ELISA values and (b) reverse transcriptase-polymerase chain reaction (RT-PCR) products in the supernatants of lavage fluids and cell pellets, respectively. Samples were generated at the reported time points following i.p. challenge with OVA. (a) Data are mean ± s.e.m. of four to six mice per group. *P < 0.05; **P < 0.01 compared with non-njected mice at 0 h. (b) Lane 1 shows the markers (m), lanes 2–6 show chemokine expression at 1, 2, 4, 6 and 24 h post-OVA injection, respectively. Amplification of GAPDH served as a control for the preparation of the cDNA and to provide an indication of the relative levels of cDNA loaded in each lane. Representative data from two separate experiments (three mice per experiment) are shown.
