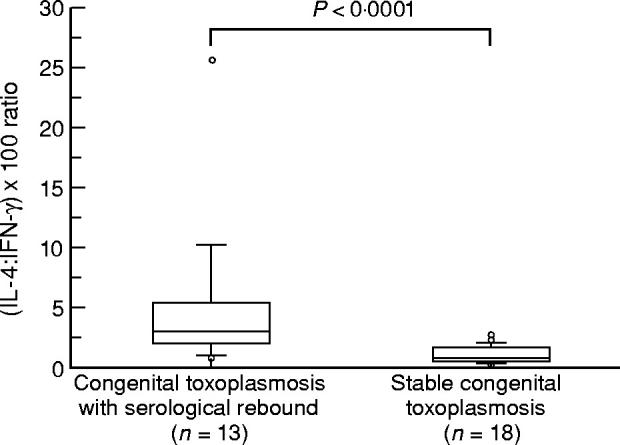
Fig. 2.

Ratio (IL-4:IFN-γ) × 100 in 18 children with stable congenital toxoplasmosis (CT) and 13 children showing serological rebound. Boxes represent values between 25th and 75th percentiles and medians; bars indicate 10th and 90th percentiles. Measures outside the bars are shown as circles. Statistical analysis (Mann–Whitney U-test) showed significantly higher (IL-4:IFN-γ) × 100 ratio in patients with serological rebound than in patients with stable CT (P < 0.0001).
