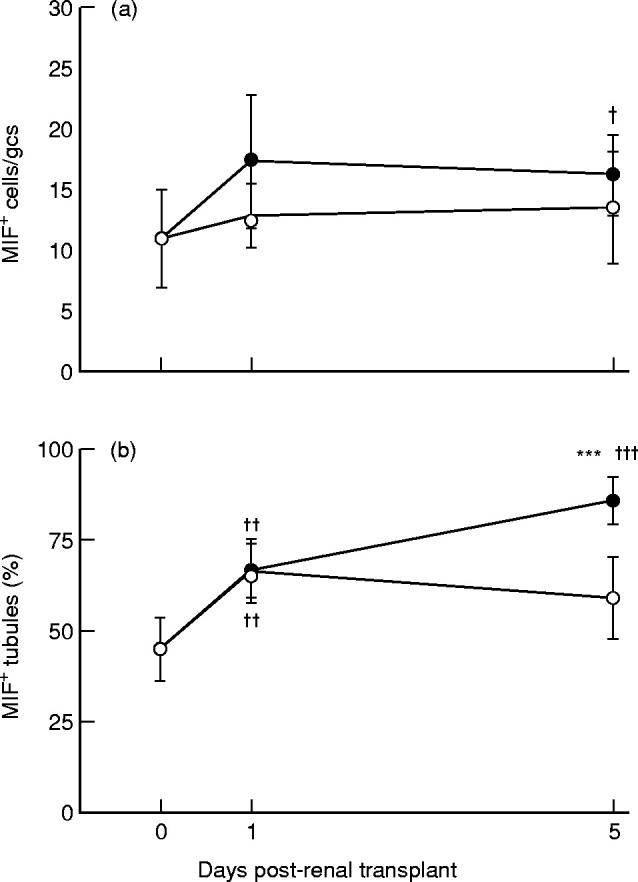
Fig. 5.

Quantification of macrophage migration inhibitory factor (MIF) immunostaining in acute renal allograft rejection in the rat. The number of: (a) glomerular cells, and (b) the percentage of tubules stained with the anti-MIF antibody were scored in normal rats (day 0), isografts (○) and allografts (•). gcs, Glomerular cross-section. Data are mean ± s.e.m. ***P < 0.001 versus day 5 isograft; †P < 0.05; ††P < 0.01; †††P < 0.001 versus normal by anova.
