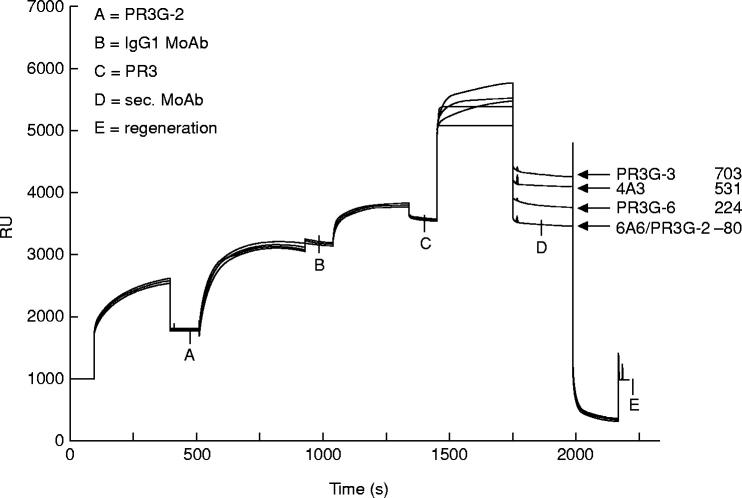
Fig. 3.
Overlay plot of sensorgrams showing the binding of the MoAbs PR3G-3, 4A3, PR3G-6, 6A6 and PR3G-2 on PR3 presented by PR3G-2. A, 800 Resonance Units (RU) binding of PR3G-2 on a rabbit anti-mouse IgG1 (RAM-IgG1) containing sensor chip. Unoccupied RAM-IgG1 sites were occupied by a control IgG1 MoAb (1400 RU) (B). C, 400 RU of captured PR3. D, binding of PR3G-3, 4A3, PR3G-6, 6A6 and PR3G-2 to PR3. RU values shown represent the increase in RU from point C to D. After regeneration RU came back to base level (E).

