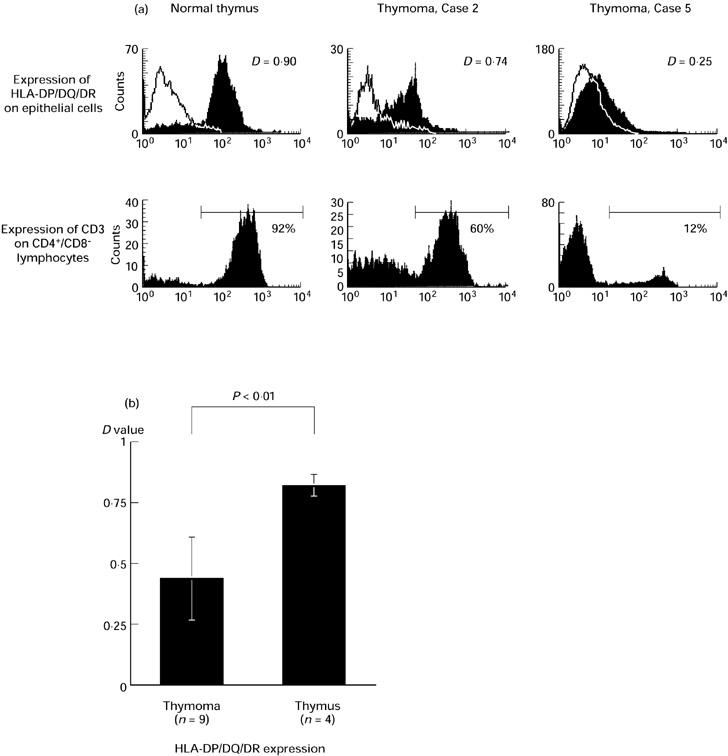
Fig. 3.

(a) HLA-DP/DQ/DR (MHC class II) expression on epithelial cells (upper) and CD3 expression among CD4+CD8− lymphocytes (lower) in typical cases. Solid lines show the negative control stains. The expression level was judged by D value in Kolmogorov–Smirnov statistics for MHC and the percentage for CD3. A normal thymus is presented as a positive control. (b) HLA-DP/DQ/DR expression of all thymoma cases and normal thymi. Thymoma: D = 0.44 ± 0.17 versus normal thymus: D = 0.82 ± 0.08; P < 0.01, significant by unpaired t-test.
