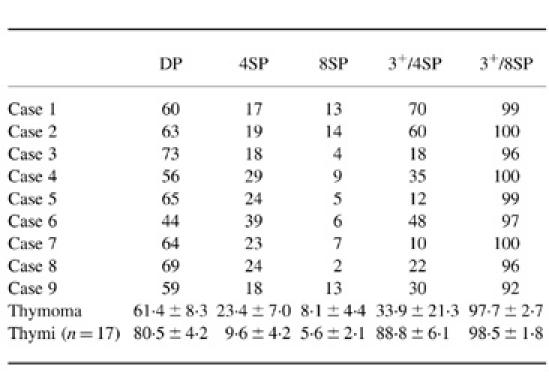
Table 2.
Phenotypic characterization of the lymphocytes in thymomas and normal infant thymi

The number indicates the percentage of cells in each population.
Results of all are shown as mean ± s.d.
DP, CD4+CD8+ cell; 4SP, CD4+CD8− cell; 8SP, CD4−CD8+ cell; 3+/4SP, CD3+ cells among CD4+CD8− cells; 3+/8SP, CD3+ cells among CD4−CD8+ cells.
