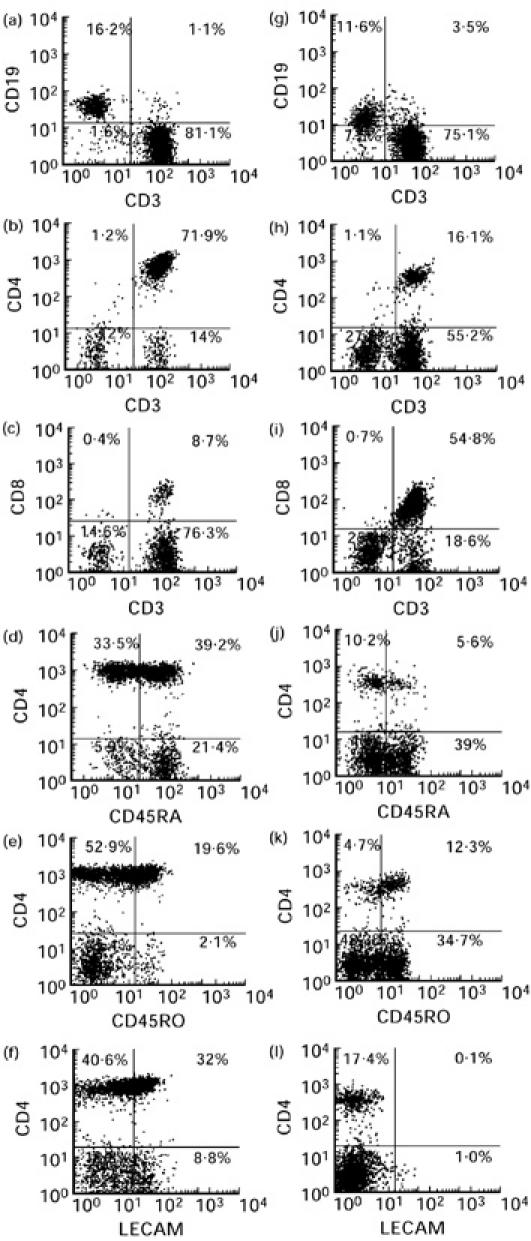
Fig. 1.

Representative dot plots illustrating the FACS analysis of lymph node cells derived from a control subject (a–f) and an HIV-1-infected individual (g–l) on the lymphocyte gate as defined by the Leucogate. The numerical values indicated on each quadrant represent the proportions of cells that are single-positive (upper left and lower right quadrants), double-positive (upper right quadrant) and double-negative (lower left quadrant) for the phenotypic markers designated on the abscissa and ordinate of each plot. The cursors for the quadrants were set based on negative control antibodies IgG1–FITC, IgG2a–PE and IgG2b–PerCp conjugated antibodies.
