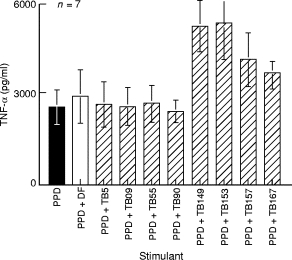
Fig. 3.

Enhancement of TNF-α secretion in seven PPD skin test donors. Results are expressed as concentration of TNF-α release in the presence of control antibodies or patient antibodies compared to PPD stimulated TNF-α release in the absence of added plasma. Vertical bars indicate mean of the group and horizontal lines indicate the standard error around the group mean. All other parameters were the same as those in Fig. 2. ▪, Stimulation with PPD alone; □, addition of control plasma; hatched bars indicate addition of TB plasma.
