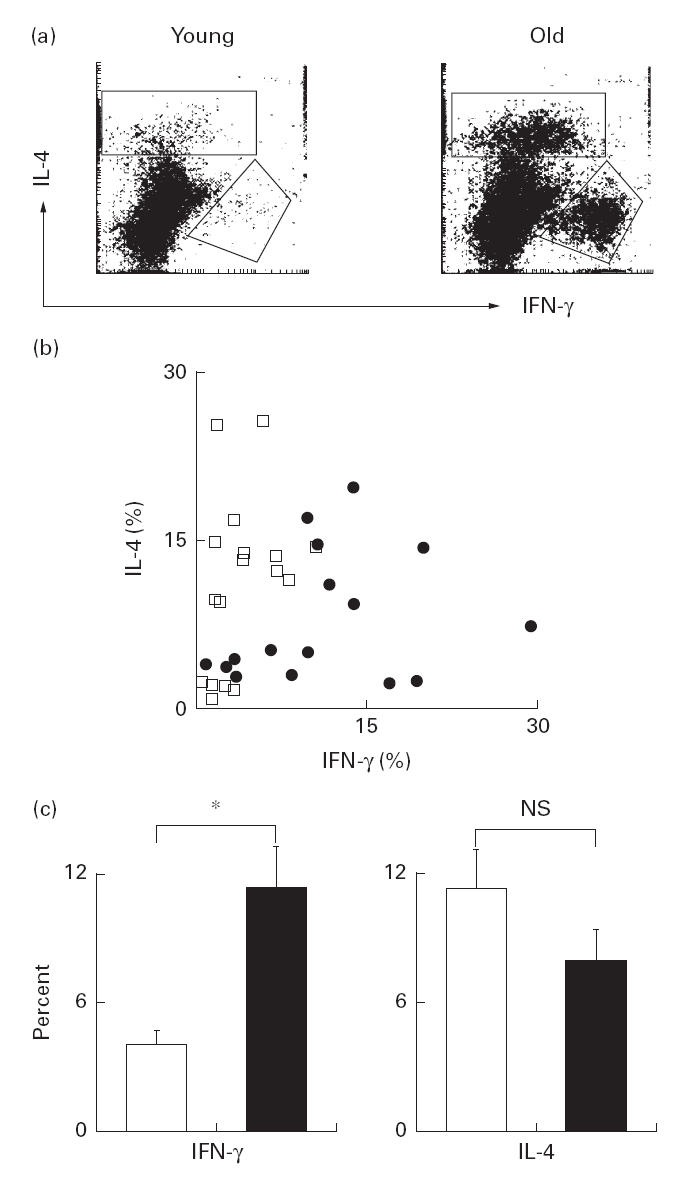
Fig. 1.

Multicolour flow cytometric analysis of CD4+ T cells producing IL-4 and IFN-γ in the cytosol. CD4+ T cells purified from young and elderly subjects were stimulated in the culture containing phorbol myristate acetate and ionomycin for 6 h and stained with antibodies to CD4, IL-4 and IFN-γ. Histograms show representative results obtained from the total of 33 subjects. CD4+ cells were gated out for the analysis of IL-4 and IFN-γ in the cytosol (a). Percentage of cells containing IL-4 and IFN-γ in CD4+ T cells for each individual was determined by multicolour flow cytometry. The overall results were shown as a dot plot graph (□, young; •, old) (b). The mean percentages of CD4+ T cells producing IL-4 and IFN-γ in the young (□) and elderly subjects (▪) are shown (mean +s.e.m.) (c). *P < 0·01; NS, not significant.
