
Fig. 3.
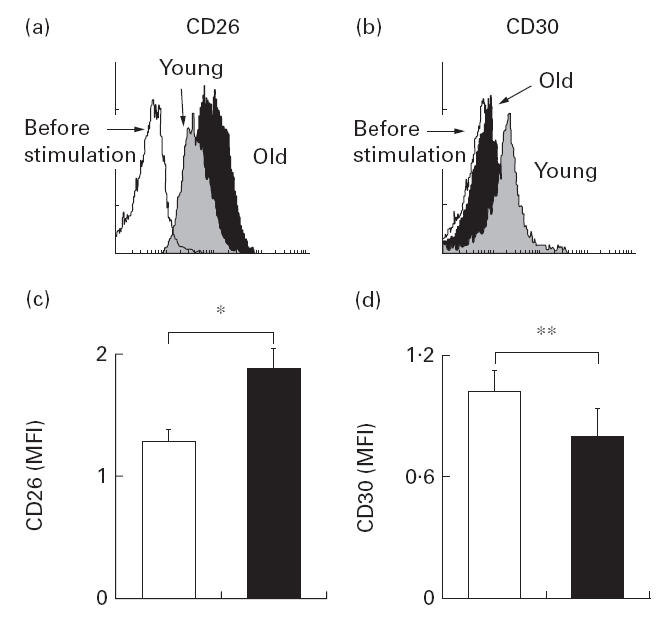
Flow cytometric analysis of CD26 and CD30 expression in the CD4+ T cells from young (grey) and elderly subjects (▪). CD4+ T cells were co-cultured with LCD32/CD80 in the medium containing anti-CD3 (0·01 μg/ml) for 60 h. Up-regulation of CD26 (a) and CD30 (b) expression in CD4+ T cells was assessed by flow cytometric analysis. Mean fluorescence intensity (MFI) of CD26 and CD30 was determined in each sample. Overall results were expressed as mean +s.e.m. (c,d) in the young (□) and the elderly (▪). *P < 0·01; **P < 0·05.