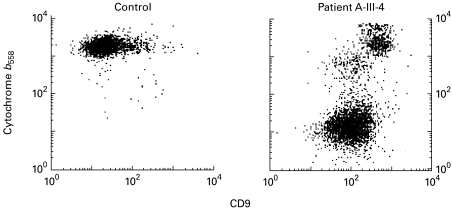
Fig. 3.
Surface expression of cytochrome b558 on neutrophils and eosinophils. Granulocytes from a healthy control (left panel) and from patient III-4 in family A (right panel) were stained with anti-cytochrome b558 (MoAb 7D5) and PE-conjugated goat anti-mouse immunoglobulin, and with FITC-conjugated anti-CD9, and the cells were then analysed with a flow cytometer. In the patient's cells, the CD9-dull neutrophils lack cytochrome b558 expression, whereas the CD9-bright eosinophils show a normal cytochrome b558 expression (for exact values see text). The control cell preparation did not contain an appreciable number of eosinophils.

