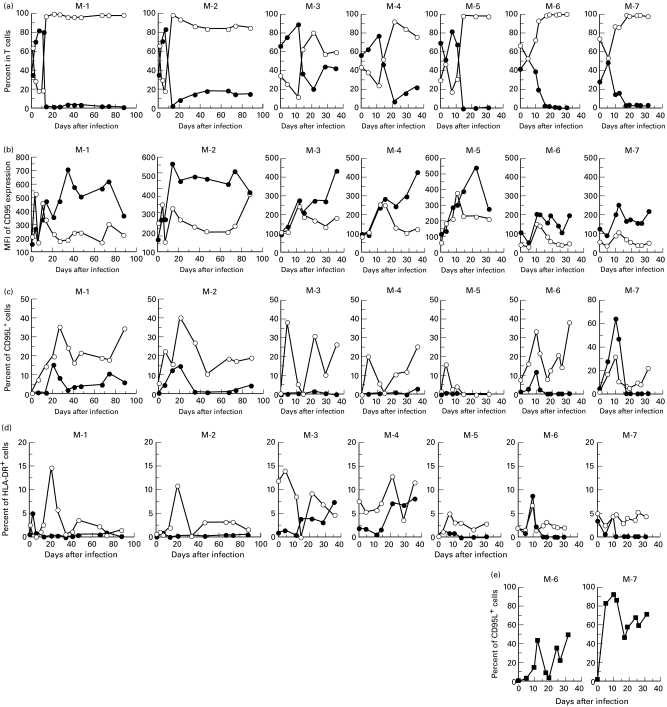
Fig. 3.
Kinetic analysis of the distribution of cell subsets in T lymphocytes and CD95, CD95L or HLA-DR expression on the lymphocyte subsets from SHIV-C2/1-infected macaques (nos M-1–7). Each figure indicates kinetic data from an individual macaque (M-number). (a–d) •, ○, CD4+ or CD8+ T cells, respectively. (a) The percentage of CD4+- or CD8+-expressing cells in T lymphocytes; (b) the mean fluorescence intensity (MFI) of CD95 expression; (c) percentage of C95L-expressing cells; and (d) the percentage of HLA-DR-expressing cells are shown; (e) percentage of CD95L (▪)-expressing cells in B cells.

