
Fig. 2.
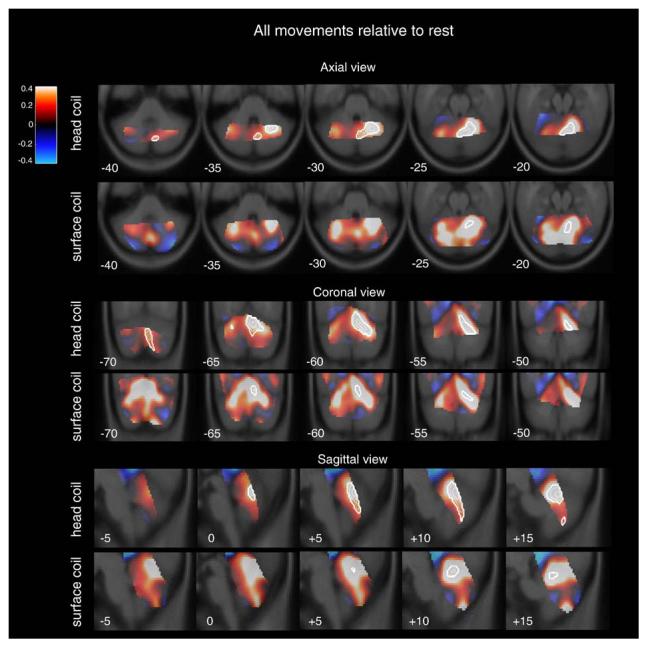
Percent signal change (color maps) within the cerebellum for all movement conditions, collapsed, relative to rest. Warm colors represent areas in which the signal was greater during movement; cool colors represent areas where signal was greater during rest. White contour overlays represent regions which reached statistical significance (p<0.05).