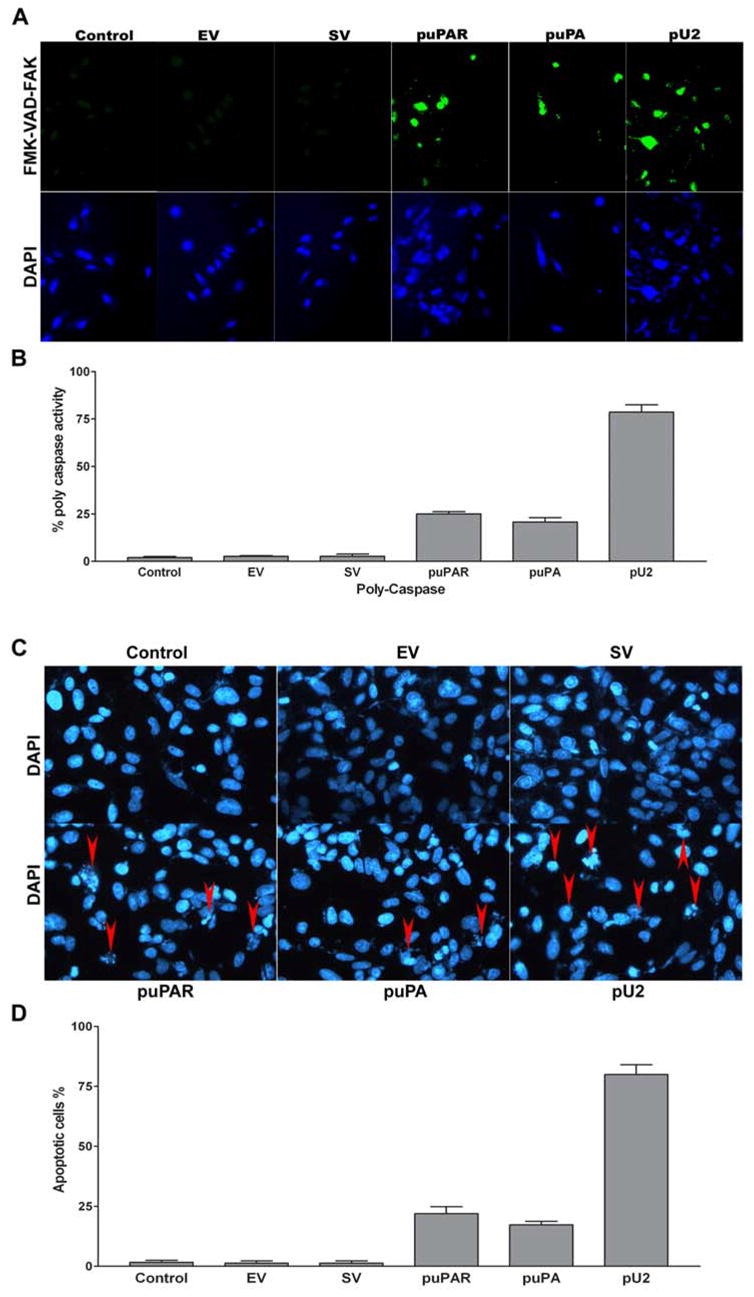
Figure 3.

SNB19 cells in chamber slides were transfected with mock, empty vector (EV)/scrambled vector (SV), puPA, puPAR and pU2 plasmid constructs. After 48 h, cells were processed as per manufacturer’s instructions (see Materials and Methods). The green fluorescent signal is a direct measure of the amount of active caspase in the cell. Caspase activation was detected by staining the cells with the FAM-VAD-FMK dye (A). Caspase activity was quantified as number of cells showing caspase activity and expressed as percent polycaspase activity (B). The values shown are mean ±SD from three different experiments (p<0.005). Initiation of nuclear degradation was determined by staining the cells with DAPI nuclear dye (C) and quantified as a percentage of apoptotic cells as determined by nuclear fragmentation (D). The values shown are mean ±SD from four different experiments (p<0.001)
