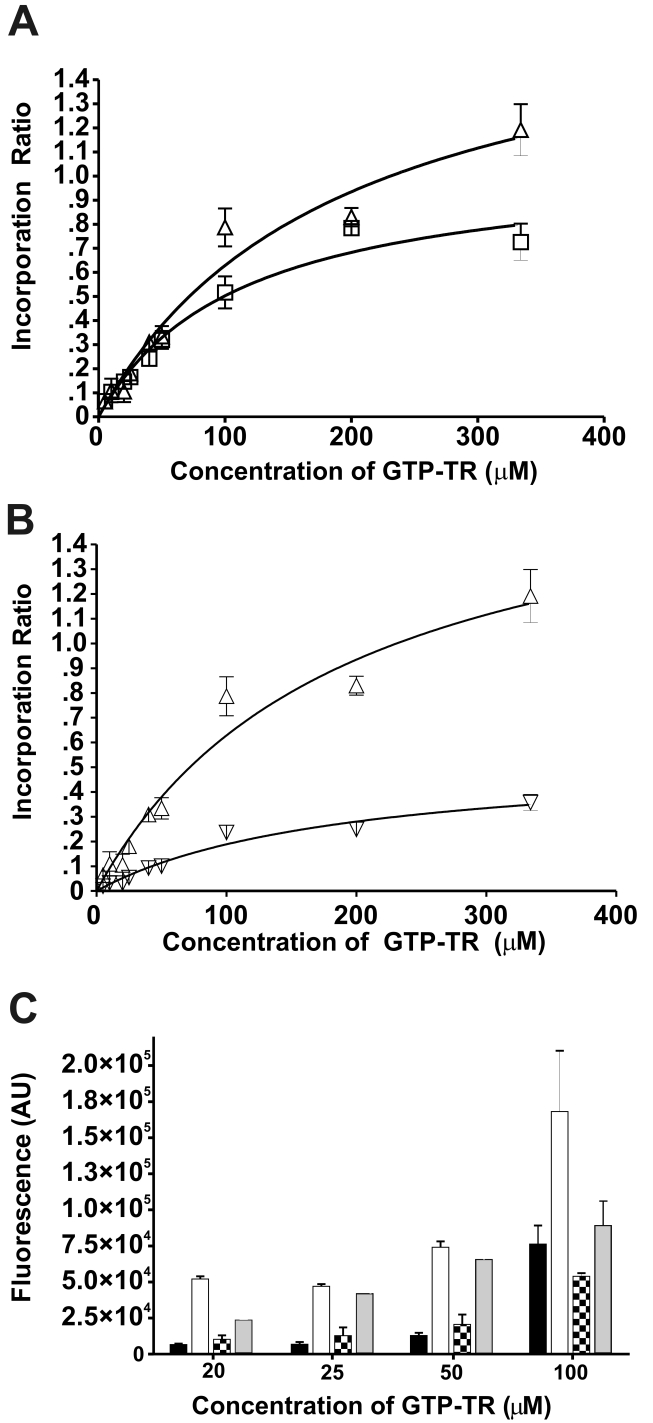
Fig. 3.
The effect of initial concentration of GTP-TR and temperature on the (A) resultant incorporation ratio, (B) under native conditions and (C) under nonreducing and reducing conditions. Complexes were prepared following non-proteolytic activation of α2M, by incubation at 37°C for 18h (□,■) or 50°C for 5h (△,▽,▲) . (A) The resultant incorporation ratio is shown as a function of initial GTP-TR concentration following incubation at 37°C for 18h (□) or 50°C for 5h (△). (B) The total incorporation ratio (△) and the SDS-sensitive associated GTP-TR incorporation (▽) are shown as a function of initial GTP-TR concentration following incubation at 50°C for 5h. (C) The fluorescence data are shown following SDS-PAGE analysis under non-reducing conditions at 37°C for 18h ( ) and 50°C for 5h (
 ) or under reducing conditions at 37°C for 18h (
 ) and 50°C for 5h (
 ) as a function of initial concentration of GTP-TR. All data points are the mean ± 1 SEM, with n=6.

