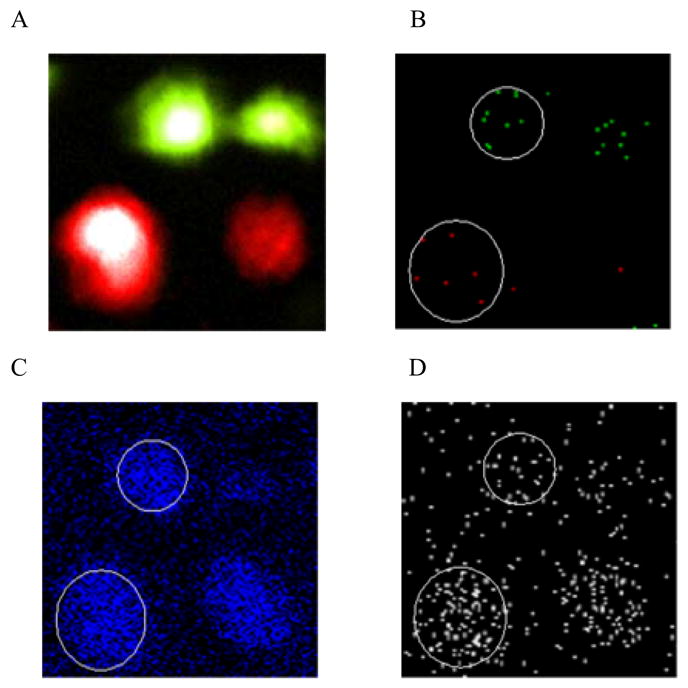
Figure 4.

Fluorescence and SIMS images of cholesterol treated and control J774 cells (100 × 100 μm2 field of view). Fluorescence and SIMS images were aligned manually using imaging software.20 (A) In-situ two-color fluorescence image of several freeze-fractured J774 cells. The treated cells were arbitrarily colored red and the control cells are shown in green. (B–D) Positive ion molecule-specific images of J774 cells that correlate with the fluorescence image in (A). In all SIMS images, black pixels indicate an absence of signal. Cells that are discussed in the text and further analyzed in Figure 5 are circled. (B) SIMS composite image for DiD (m/z 860; red) and DiI (m/z 834; green). (C) SIMS image for C5H9+ hydrocarbon (m/z 69; blue). (D) SIMS image for cholesterol (m/z 366–370; white).
