
Figure 5.
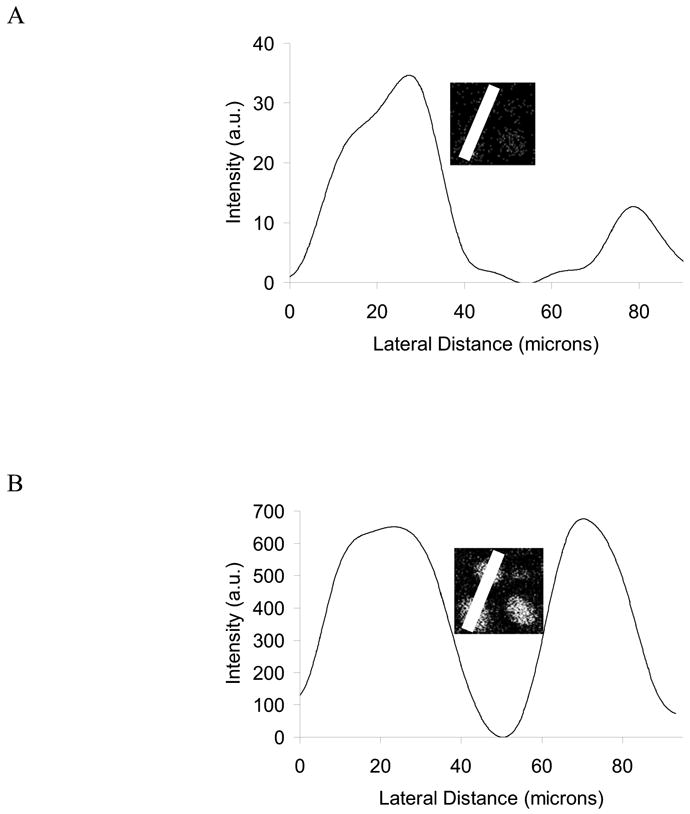
Line scans comparing a cholesterol-treated J774 cell and a control J774 cell. The insets depict the distance selected for the line scan, which was drawn from the lower left to the upper left of the each respective chemical map. (A) Line scan for cholesterol(m/z 366–370). (B) Line scan for C5H9+ hydrocarbon (m/z 69).