Figure 2.

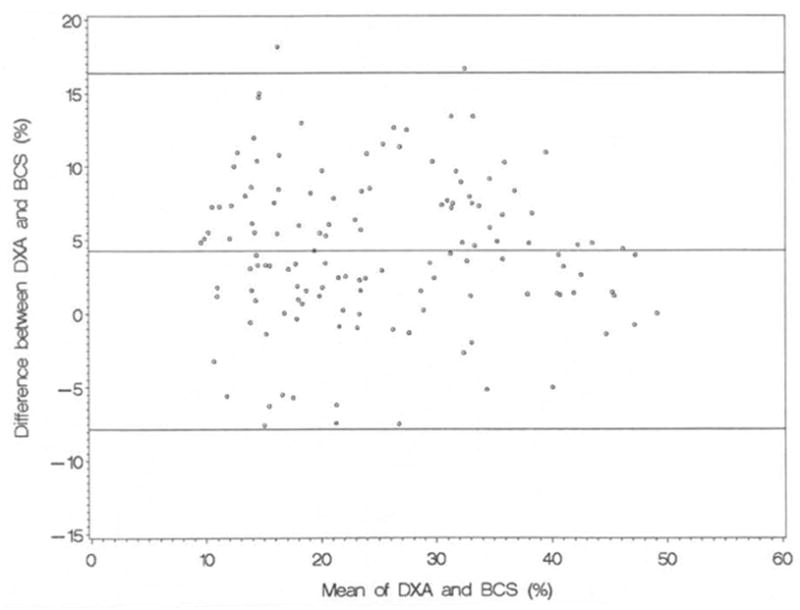
Bland-Altman plot of limits of agreement in percent body fat between DXA and BCS. Parallel lines indicate the mean difference ± 2 SD.

Bland-Altman plot of limits of agreement in percent body fat between DXA and BCS. Parallel lines indicate the mean difference ± 2 SD.