
FIGURE 1.
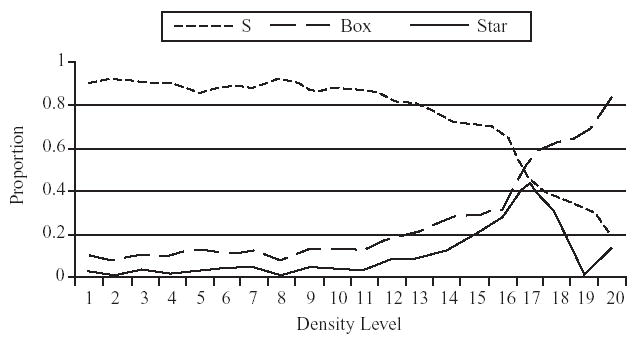
Response selection as a function of normalized stimulus density. Mean proportion of responses to the S and the Box (target) on trials in which the participants attempted the primary task, and mean proportion of responses to the star (uncertain response).