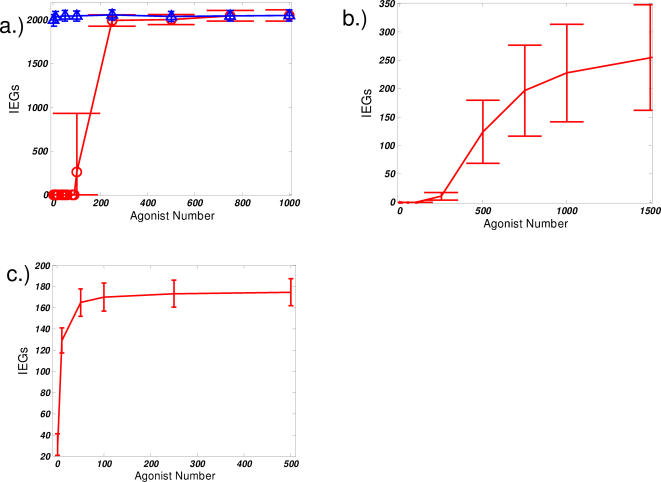
Figure 6. Comparison of dose response curves.
Average values of active IEG products after the stimulus has been removed for 20 minutes (t = 50 minutes) a.) feedback regulation model. forward (red circles) and backward (blue triangles) curves are shown. Strong hysteresis is observed b.) cooperative reaction model c.) linear, mass-action kinetics reaction model “error bars” are computed by considering the standard deviation—one measure of the magnitude of noise in the signaling process.

