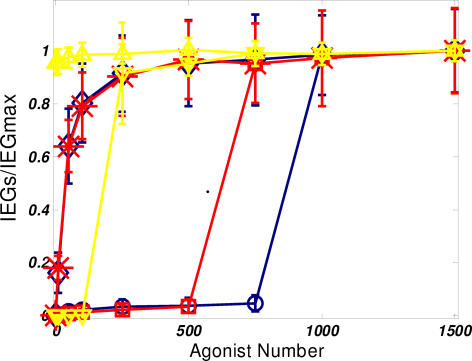
Figure 7. Evaluation of the effects feedback strength.
Forward and backward dose response curves for varying feedback strengths, α = 1 (blue), α = 2 (red), and α = 5 (yellow). Different markers correspond to the forward and backward dose response. At high feedback strengths, the response is irreversible. At low feedback strengths, the active state can reverted be back to the inactive state. Again, values are calculated at t = 50 minutes.

