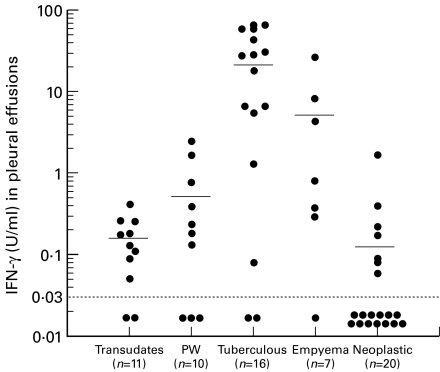
Fig. 3.
Individual IFN-γ levels in pleural fluid in various diseases. Means are indicated by horizontal bars. PW, Paragonimiasis westermani. IFN-γ concentrations in the tuberculous group were significantly higher than those in transdates (P < 0·001), empyema (P < 0·05), neoplastic (P < 0·0001), or in PW (P < 0·001) groups. Detection limit of IFN-γ is represented by the horizontal dotted line (< 0·03 U/ml).

