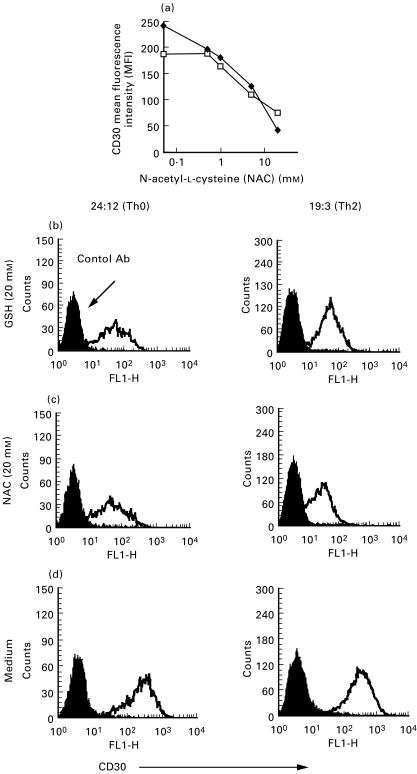
Fig. 2.
Cell surface expression of CD30 in human Th0 and Th2 clones is decreased after treatment with NAC. Surface CD30 expression was investigated with flow cytometry (using the anti-CD30 MoAb Ber-H2, Dakopatts), in Th0 (□) and Th2 (•) clones after activation with anti-CD3 antibodies for 16 h in serum-free medium supplemented with IL-2 (20 U/ml) and in the presence or absence of NAC (0·5–20 mm) (a). The two clones shown (24 : 12 and 24 : 9) are representative of experiments with three Th0 clones and two Th2 clones. The histograms (b-d), show CD30 mean fluorescence intensity from one Th0 clone (left) and one Th2 clone (right), activated with anti-CD3 antibodies for 16 h in the presence of GSH (20 mm) (B), NAC (20 mm) (c) or without any treatment (d). These figures are representative of 3–5 independent experiments.

