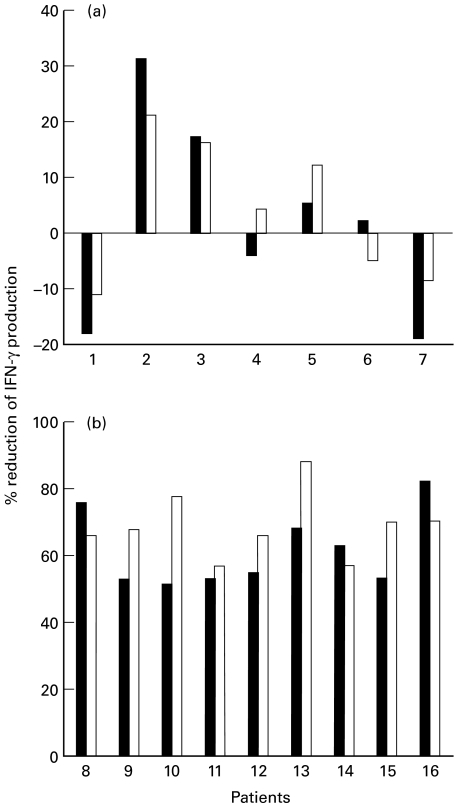
Fig. 2.
Decrease of IFN-γ expression studied on a single patient basis after 4 months of treatment with ribavirin and IFN-α with respect to pretreatment values. (a) Patients that did not gain normal ALT values after 4 months of treatment. (b) Patients with normal ALT values after 4 month of treatment. The percentage of IFN-γ-producing cells was determined by FACS (▪) as described in the legend of Table 2. IFN-γ production by activated PBMC was determined by ELISA (□) testing of supernatants from unfractionated PBMC. The percenc reduction of IFN-γ production was calculated as follows: 100-(baseline percentage IFN-γ expression/4 months percentage IFN-γ expression).

