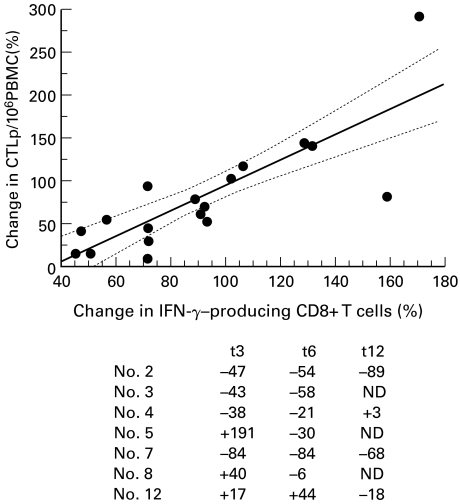
Fig. 2.
Correlation between changes in the proportion of anti-HIV Gag and Pol CTLp and IFN-γ-producing CD8+ T cells. Data are expressed as percentage of changes from baseline after 3, 6 and 12 months of HAART and referred to 7 out of 20 patients according to the numeration used in Table 1. The numbers in the table indicate the percentage change from baseline in the proportion of CTLp/106 PBMC at t3, t6, and t12, respectively.

