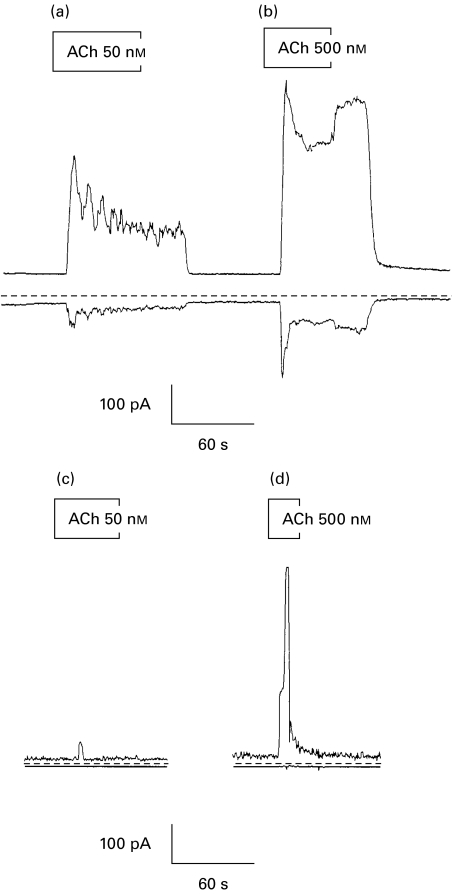
Fig. 3.
Time course of ACh-evoked changes in K+ and Cl− currents. Representative traces showing the time course of changes in K+ (upper trace) and Cl− current (lower trace) measured in acinar cells from control (a–b) and SjS patients (c–d) in response to ACh stimulation (50–500 nm). The dotted line indicates 0 current.

