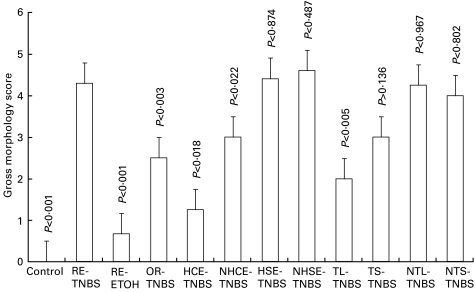
Fig. 3.
Gross morphology scores of the distal colon (0–8 cm) in different groups and their statistical analysis. RE-TNBS showed significant (P < 0·001) inflammation when compared to normal control and the RE-ETOH group. The inflammatory scores were significantly (P < 0·005 to P < 0·02) less in the HCE-TNBS, NHCE-TNBS, TL-TNBS and OR-TNBS groups when compared with RE-TNBS group showing protection. However, the inflammation scores in HSE-TNBS, NHSE-TNBS, NTL-TNBS, NTS-TNBS and TS-TNBS groups were not significantly different than the RE-TNBS group. Abbreviations as given in Table 1.

