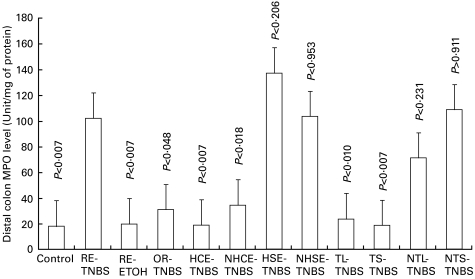
Fig. 5.
MPO levels in the distal colon of rats in various groups. The legends are as described in Table-1. When compared with the RE-TNBS group, the MPO levels were significantly (P-values ranged from <0·003 to <0·01) lower in the HCE-TNBS, NHCE-TNBS, TL-TNBS and TS-TNBS groups, but not with HSE-TNBS, NHSE-TNBS, NTL-TNBS and NTS groups showing protection in the former groups. The MPO values in the protected group were not significantly different than the control and RE-ETOH groups.

