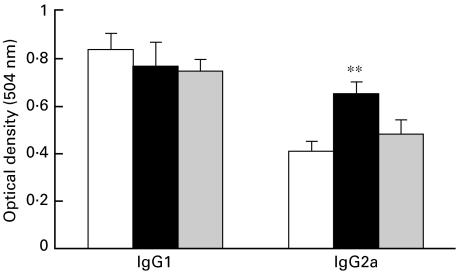
Fig. 6.
Serum antibody isotypic profiles in sera from different group of rats on day 14 p.i., as determined by ELISA. Groups I (□), II (▪) and III ( ), respectively, represent rats injected s.c. with PBS, EAE-DC or normal rat DC, 4 weeks prior to immunization. Results represent mean ± s.d. for 4 rats per group. **P < 0·01 when compared with Group I.

