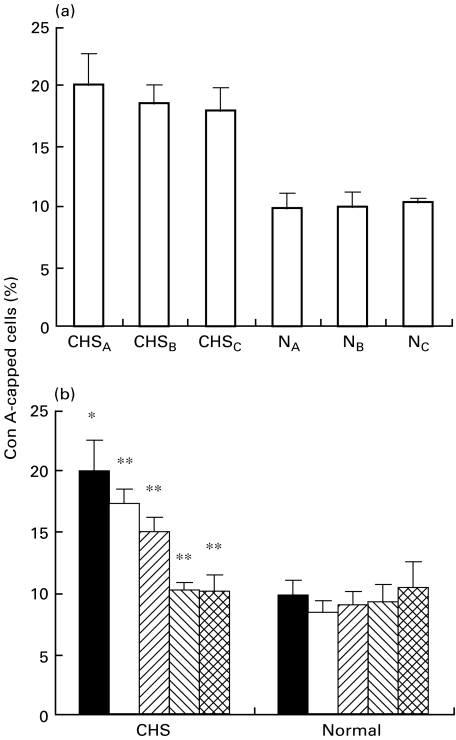
Fig. 1.
Effect of E-64-d on Con A cap formation in CHS and normal cell lines. (a) The cells (1×10⁶/ml) from three CHS (CHSA,B,C) and three normal (NA,B,C) cell lines were incubated with FITC-Con A (20 μg/ml) for 30 min at 37°C, and the Con A-induced capping was determined as described in Patients and methods. (b) The cells were cultured in the presence of various concentrations of E-64-d for 24 h, and then FITC-Con A (20 μg/ml) was added and the Con A-induced capping was determined. The column represents the mean ± s.e. of at least four experiments. CHS: the mean ± s.e. of three normal cell lines. Normal: the mean ± s.e. of three normal cell lines. *P < 0·01, significant when compared with normal cell lines without E-64-d.**P < 0·01, significant when compared with CHS cell lines without E-64-d. ▪ 0; □ 0·11;  0·33;
0·33;  1;
1;  3 E‐64.9 (μg/ml).

