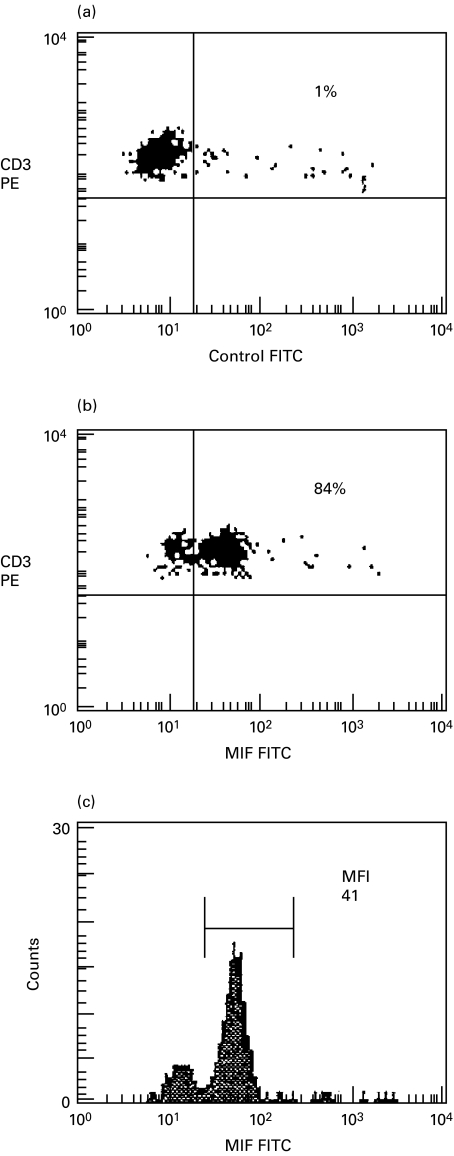
Fig. 1.
Intracellular MIF expression in freshly isolated CD3+ peripheral blood T cells. Peripheral blood T cells were gated on the basis of cell size and granularity (forward scatter and side scatter) after surface labelling with anti-CD3 (PE-conjugated). Fluorescence quadrants were set using an FITC-conjugated control antibody in the dot plot in (a). (b) The percentage of T cells expressing MIF is shown in the upper right quadrant. A histogram illustrating the median fluorescence intensity (MFI) of MIF in the CD3+ T cell population is shown in (c).

