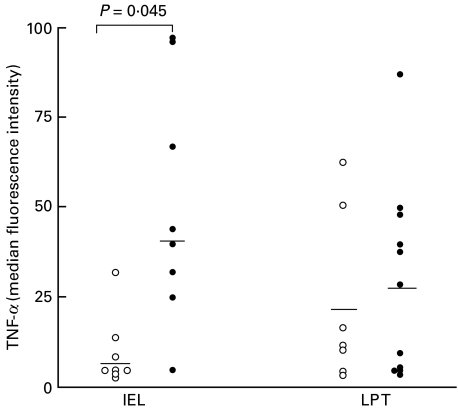
Fig. 3.
Intracellular TNF-α levels in CD3+ intraepithelial lymphocytes (IELs) and lamina propria T cells (LP T) from coeliac patients (•) and control subjects (○). Results are shown as MFI values of TNF-α and horizontal bars indicate the median levels. P-values illustrate significant differences between coeliac patients and controls.

