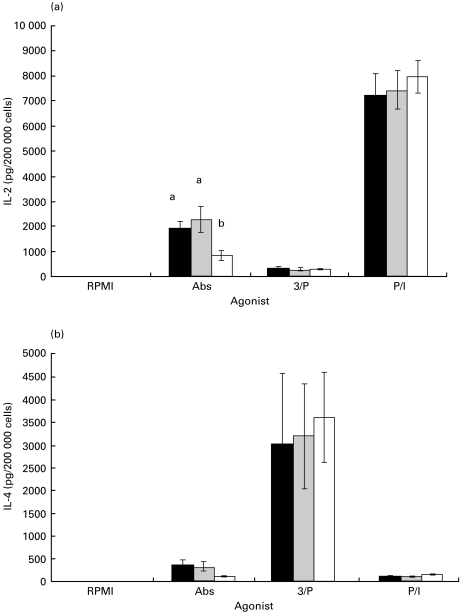
Fig. 3.
Effect of dietary fatty acids on IL-2 (a) and IL-4 (b) production by purified murine splenic CD4 T cells. Mice were fed diets enriched in SAF (black bars), EPA/DHA (grey bars) or FO (white bars) for 14 days, and purified splenic CD4 T cells were cultured with various agonists for 48 h. IL-2 and IL-4 in culture supernatant fluids were quantified by ELISA as described in Materials and methods. Values (n = 4) represent the mean ± s.e.m. in pg/200 000 cells. Different letters denote significant differences within each agonist group (P < 0·05). R, RPMI; Abs, αCD3/αCD28; 3/P, αCD3/PMA; P/I, PMA/Ionomycin.

