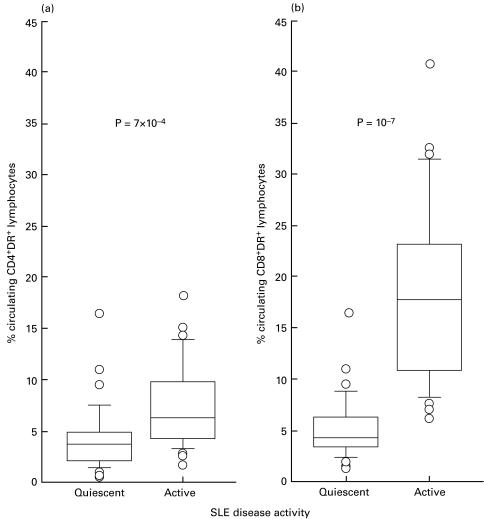
Fig. 1.
Comparisons of the percentages of circulating CD4+DR+ (a) and CD8+DR+ (b) T-cell subsets among total lymphocytes between patients with active (n = 24) and quiescent (n = 36) SLE (non-parametric Mann–Whitney U-test). The medium bar within the box represents the median value. The outlines of the boxes show the 25% and the 75% percentiles, while the bars outside the boxes represent the 10% and 90% percentiles. (○), Values outside this range. In (a), P = 7 × 10⁻⁴; in (b), P = 10−7.

