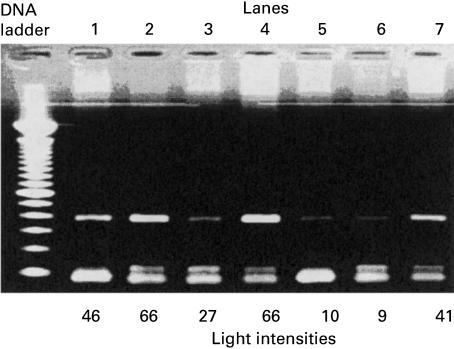
Fig. 2.
Agarose gel analysis of sjTREC bands showing a correlation between band intensities and gender. Lane 2 containing sjTREC from a 23-year-old female has a greater intensity when compared with sjTREC of an age-matched male (lane 1). Lane 4 is the sjTREC for a 25-year-old female. Lane 7 contains a DNA band for a 42-year-old female and has a higher intensity than a 40-year-old male's DNA band (lane 3). Lanes 5 and 6 containing sjTREC bands for a 55-year-old female and a 48-year-old male, respectively, are shown to possess bands of almost equal intensities. The actual light intensity values for sjTREC DNA bands are shown below each lane.

