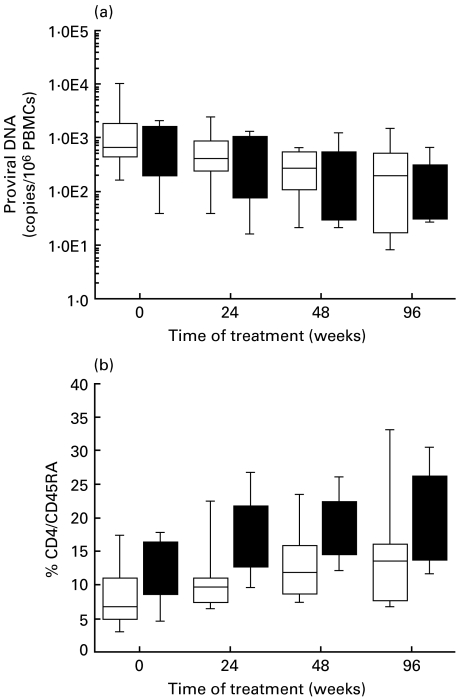
Fig. 1.
Proviral DNA levels and number of CD4 cells with a naïve phenotype. (a)Box plot representation of the number of proviral DNA copies in peripheral blood mononuclear cells in patients treated with HAART (□) or HAART plus IL-2 (▪) and analysed for the indicated time periods. Values were obtained by the simultaneous quantification of proviral DNA molecules and of the single copy β-globin cellular gene, a precise indicator of cell number. Quantifications were obtained using a single competitor for both measurements, as already described [25,40]. Each horizontal line in the box plot shows the 5th, 25th, 50th, 75th and 95th percentile distribution of values, from top to bottom (boxed are values from the 25th to the 75th percentiles). (b) Naïve T cells bearing the CD4/CD45RA/CD62L phenotype at different times after treatment. The box plot representation is as described in the legend for (a).

